The following show some examples of GeoQO's more interesting features. Please read the GeoQo Manual for many more examples, as almost every documented feature has examples of what geoqo can do.
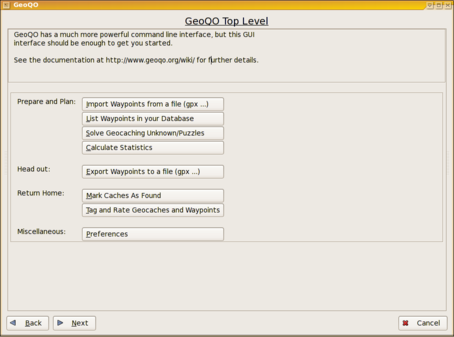
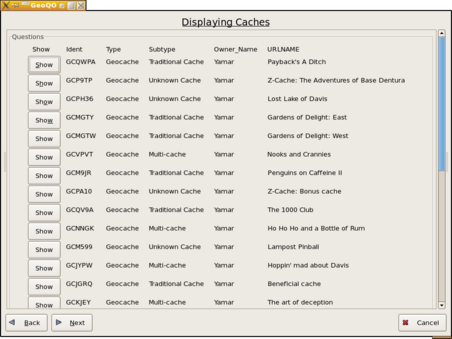
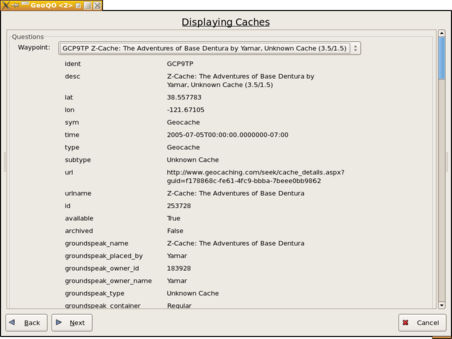
The GUI support in GeoQO is only just beginning, but here is some early sample shots (click for a larger view):
| The First GUI Screen/Menu |
|---|

|
| Showing a list of caches |
|---|
|
| Showing details of a single cache |
|---|
|
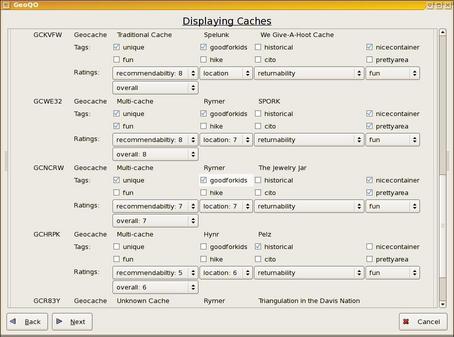
| Tagging and Rating Caches |
|---|
|
Ok, these are horrible (low light pictures) of my Garmin Etrex and my TomTom of the same area. They are both showing 5 caches (3 different sizes and one which is a solved puzzle cache). Note the first two characters of the identifier names indicate the difficulty and terrain ratings (1-9) (see the Gctodiff plugin).
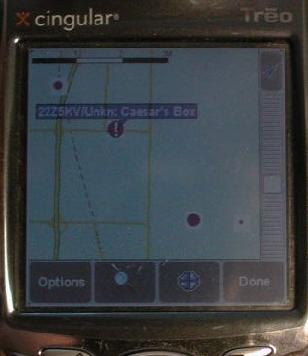
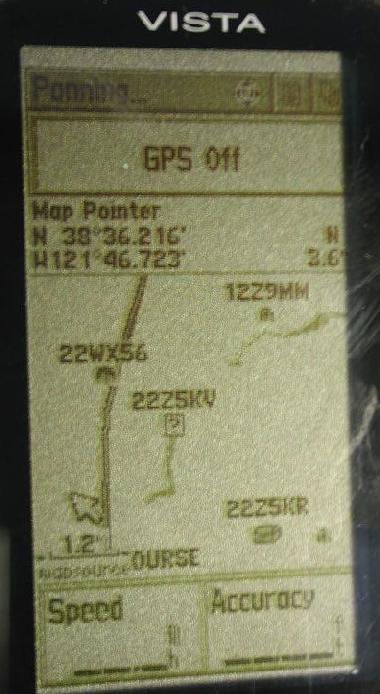
To do this for the TomTom I have to create different output files per each symbol, which was a pain. Until GeoQO existed and now it's easy and I get the maximum possible displayed information on a screen.
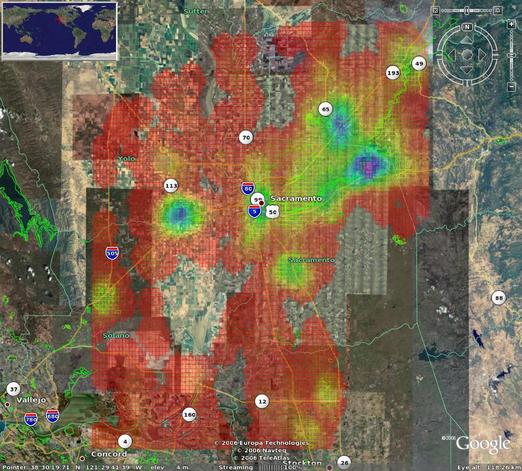
The following image shows a cache-density plot. These plots are placed into a Google Earth KML file which you can then view and zoom around in Google Earth. For those of you who are into number of caches found, this is a perfect way to find out where you should go caching next (head for the purple spots).
The following two graphs show which months of the year caches have been placed broken down by the creation time. Near me, it's cold in the winter but not that cold so the graph is fairly flat. In Montreal Canada, however, it's a bit more chilly in the winter and thus my pocket query shows that there is a much bigger dip in the winter when caches are placed.
> geoqo -s 'set:import:near me' -d graph/placed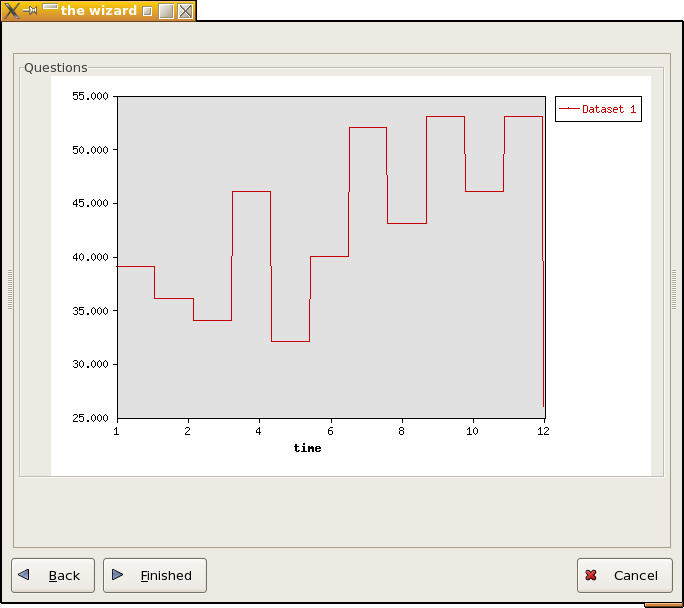
> geoqo -s 'set:import:montreal' -d graph/placed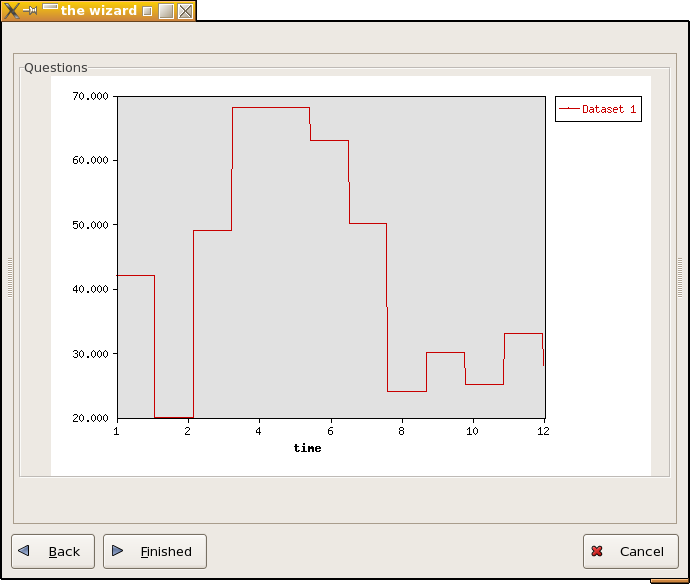
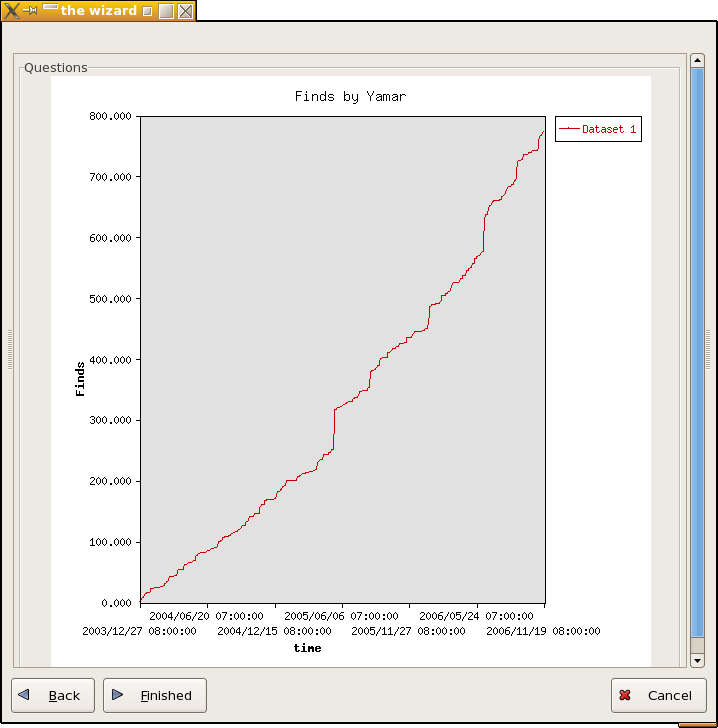
The following screen shows a graph of my finds, created by the following command:
> geoqo -s log:finder=Yamar -d graph/find:finder=Yamar